Basic R markdown
136 minute read
R Markdown
This is an R Markdown document. Markdown is a simple formatting syntax for authoring HTML, PDF, and MS Word documents. For more details on using R Markdown see http://rmarkdown.rstudio.com.
When you click the Knit button a document will be generated that includes both content as well as the output of any embedded R code chunks within the document. You can embed an R code chunk like this:
summary(cars)
##      speed           dist
##  Min.   : 4.0   Min.   :  2.00
##  1st Qu.:12.0   1st Qu.: 26.00
##  Median :15.0   Median : 36.00
##  Mean   :15.4   Mean   : 42.98
##  3rd Qu.:19.0   3rd Qu.: 56.00
##  Max.   :25.0   Max.   :120.00
Math
$$\sum(a+b)$$
Inline math \(\sum(a+b)\).
Including Plots
You can also embed plots, for example:
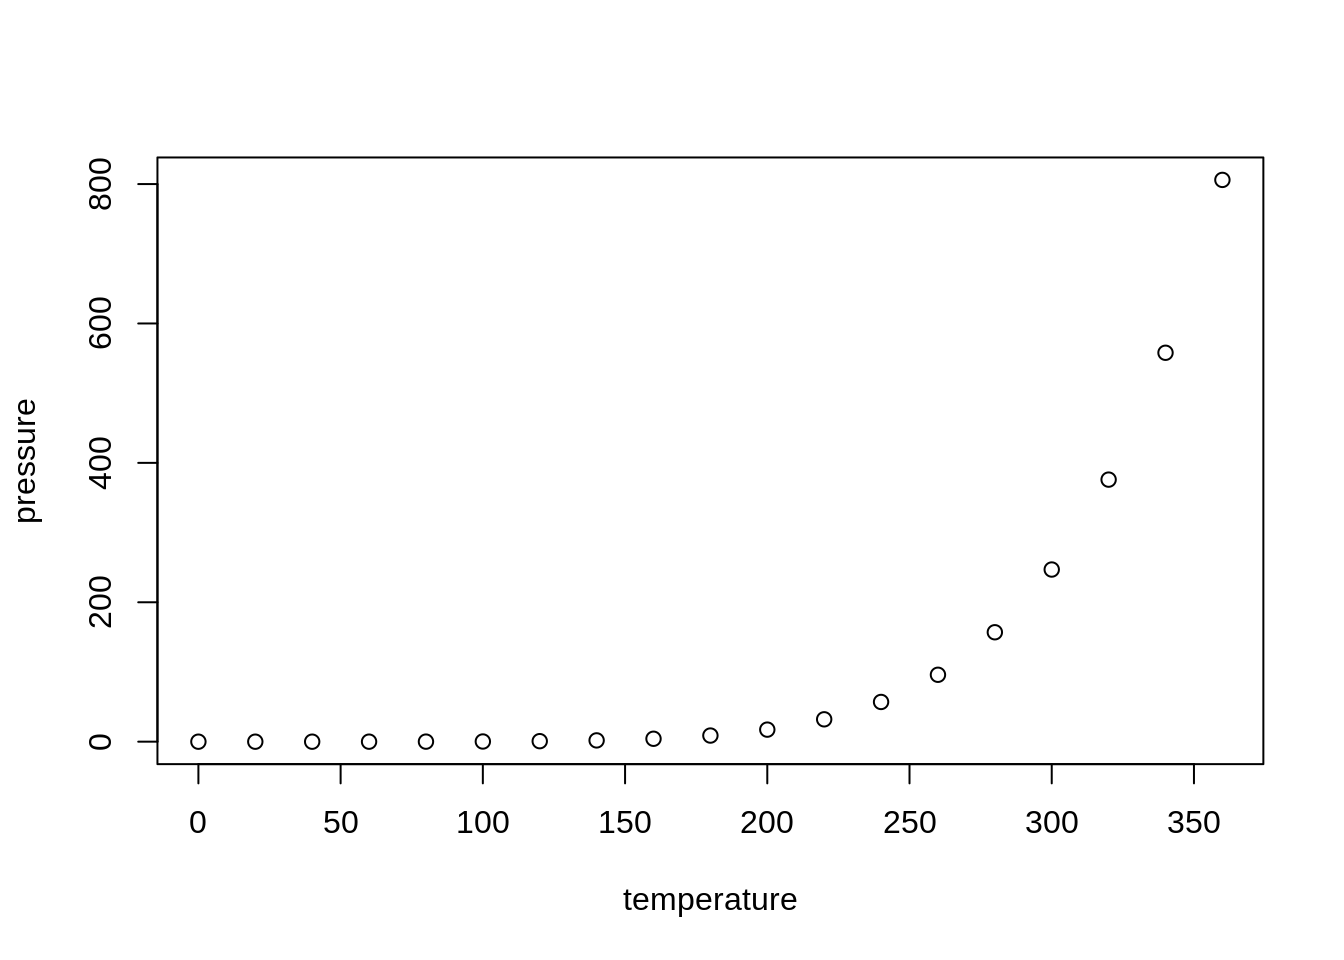
Note that the echo = FALSE parameter was added to the code chunk to prevent printing of the R code that generated the plot.
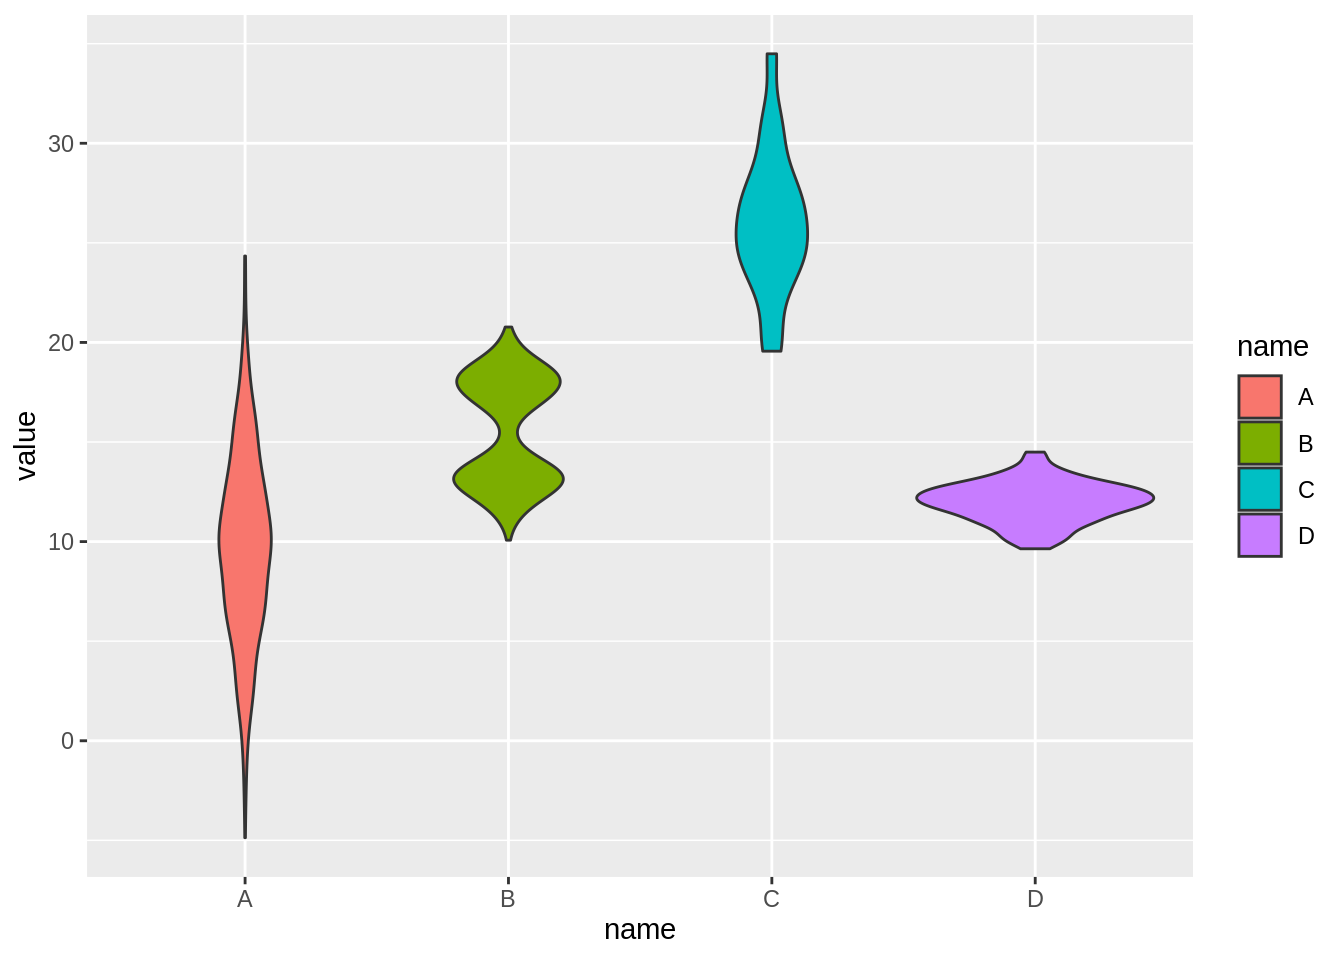
Violin Plot with ggplot2
# Library
library(ggplot2)
# create a dataset
data <- data.frame(
  name=c( rep("A",500), rep("B",500), rep("B",500), rep("C",20), rep('D', 100)  ),
  value=c( rnorm(500, 10, 5), rnorm(500, 13, 1), rnorm(500, 18, 1), rnorm(20, 25, 4), rnorm(100, 12, 1) )
)

# Most basic violin chart
p <- ggplot(data, aes(x=name, y=value, fill=name)) + # fill=name allow to automatically dedicate a color for each group
  geom_violin()
p
Violin Plot with interactive plot (plotly)
library(plotly)
ggplotly(p)
Add references (R Core Team 2020).
References
R Core Team. 2020. R: A Language and Environment for Statistical Computing. Vienna, Austria: R Foundation for Statistical Computing. https://www.R-project.org/.
Feedback
Was this page helpful?
Glad to hear it! Please tell us how we can improve.
Sorry to hear that. Please tell us how we can improve.